Magnetic Levitation
Levitation
- Introduction
- Why
- Other Maglev
- Hard Drive Maglev
- Schematic
- Parts List
- Buying Parts
- Woodworking
- Other's
- Photographs
- Infrared Emitter
- Photodetector
- Reference Det
- Difference Amp
- Feedback Loop
- Loop Equations
- Bode Plot
- Phase Lead
- Output Amp
- Coil Driver
- PWM
- Lifting Coil
- PSPICE
- Build Time
- PCB
- Power Supplies
- Setup
- Test Power
- Test IR Emitter
- Test Signal Det
- Test Ref Det
- Adjust Sensing Res
- Test Diff Amp
- Test Non-Invert Amp
- Test Coil Driver
- Test Lifting Coil
- Results
Feedback Loop and Bode Plot
How does a Bode plot graphically represent a transfer function? How does a common RC network look in a Bode plot?
Bode Plot
A graphical approach is usually the easiest way to analyze and design feedback loops. So we will review how to represent the transfer function graphically. There are several ways to do so, but the method suggested by H. W. Bode in the 1930s is particularly useful.
Bode's method consists of plotting two curves, the log of gain, and phase, as functions of the log of frequency.
Usually the gain in decibels, abbreviated dB, and the phase are plotted linearly along the y axis on graph paper that has several cycles of a log scale on the x axis. Each cycle represents a factor of ten in frequency. This special paper is known as semilog graph paper, and it or a computer program with log-log graphing are essential for making Bode plots.
Definition of Decibel
The decibel is a logarithmic measure of a voltage ratio, or gain. It is defined as
![]()
Or by the equivalent exponential form as
![]()
The calculation can be done mentally with the aid of a small table of values. Memorization is practical because reciprocal values of gain convert to the same value of decibel, except for sign.
| Voltage ratio | dB |
| 1/100 | -40 |
| 1/10 | -20 |
| 1/2 | -6 |
| 1/SQRT(2) | -3 |
| 1 | 0 |
| SQRT(2) | 3 |
| 2 | 6 |
| 3.16 | 10 |
| 5 | 14 |
| 10 | 20 |
| 100 | 40 |
Cascading Networks
Because of the properties of logarithms, when networks are cascaded so their gains multiply, the overall gain in decibels is obtained by adding the decibels of the networks.
Therefore, three cascaded networks with gains of 2, 2, and 10 would have a total gain of 2 x 2 x 10 = 40, or example, and the gains in decibels would combine as 6 + 6 +20 = 32dB. The same idea makes it easy to convert to and from decibels by breaking down a total into its components.
Another example going the other way is 34 dB, which is 14 + 14 + 6 dB, so the gain is 5 x 5 x 2 = 50.
Phase Lag Network
 Whew.
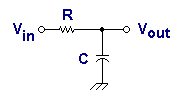
Having covered all this background, we are ready to make a Bode plot. Let's start with a "phase
lag network" as shown in this schematic, also known as a low-pass filter.
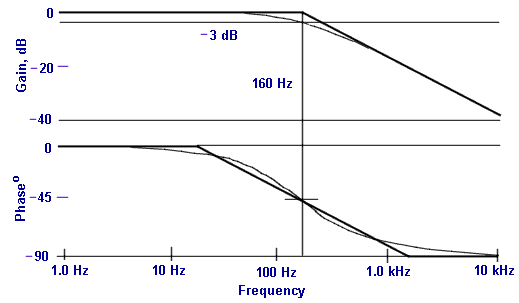
The sole parameter characterizing this network is its time constant T , and we will arbitrarily take this to be 1 ms for this exercise. The break frequency is thenf = 1/(2 pi T) = 160 Hz.

At low frequencies the gain is flat and unity, or 0 dB. At high frequencies the gain rolls off inversely with frequency, decreasing by a factor of 2 (or 6 dB) for every frequency doubling. This is an increase of one octave wherever it occurs.
Alternatively, the roll-off rate can be expressed as 20 dB per decade (a factor of 10 in frequency), which results in a straight line on semilog graph paper with a slope of -6 dB per/octave. It intersects the low-frequency curve at the break frequency.
The straight line segments show an asymptotic representation of the lag characteristic, which is not quite exact near the break frequency. There the gain is actually 1/SQRT(2) = 0.707, or -3 dB. Calculating more points enables us to draw the curve as accurately as desired, but the single 3 dB down point and the two asymptotes suffice to get the picture. Even that extra graphing is seldom done, however, since the process entails extra effort. The asymptotic form is generally more useful, since it shows the break frequency explicitly.
Although the x axis is a log frequency scale, the values of frequency are indicated directly for convenience. So, as far as the numbers are concerned, it is a frequency scale, but the markings are not spaced uniformly.
Looking at the phase plot, we see it is 0 degrees well below cutoff, -90 degrees well above, and -45 degrees at the break frequency. We see the transition is more gradual than that of the gain plot. A good approximation to the curve is a straight-line asymptote: 0 degrees at one-tenth of the break frequency and -90 degrees at ten times the break. On a Bode plot the line will be exact at the break frequency, showing a phase of -45 degrees.
For this lag network and for many others that constitute a subset known as minimum phase networks (MPNs), the phase characteristic contains no information in addition to that carried by the gain plot. Therefore, the phase curve is often not plotted at all.
| < Previous | Page 17 of 37 | Next > |
©1998-2026 Barry Hansen